This is a sorted US county list of doubling numbers for positive confirmed cases of COVID19 averaged over the last four days. Just computing, log(2)/(log(X_n)-log(X_n-1)) which is the doubling number.
The doubling number is the number of days predicted for the positive confirmed cases to double in number. For more information, consult the US State sorted doubling numbers
A doubling number of zero, represents an infinite doubling — that is to say that the number of cases has remained constant, neither increased nor decreased. A negative doubling number is that the number of cases has decreased, this is the result of a bookkeeping error, or that the data has been revised. Small positive doubling numbers are the most concerning and reflect that there may be sudden increases in case counts in a county.
If you select a County, by clicking, you can see a County Graph, or Chart.
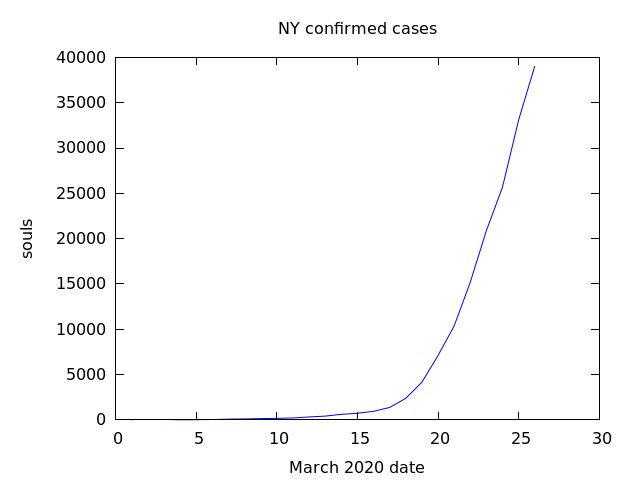
These graphs show the totals of confirmed COVID19 cases and reported deaths for each US County. I am not graphing the logarithm but just the simple numbers. The reason is that the numbers are not large enough to justify using logarithms at this time. If you have looked at my State charts, you can see the merit of using logarithms — particularly for New York, New Jersey, etc. The purpose of these charts is to provide basic information in an attempt to replace fear and confusion with knowledge and control. I am getting daily updates from the New York Times Github database.
However, I am sorting these counties by doubling numbers because I am trying to filter Counties which have had sudden changes.
The following link is to the table with data updated daily:
No warranties expressed or implied as to the accuracy of these doubling calculations.

2 thoughts on “Covid19 US County sorted doubling numbers (updated daily)”
testing