
This is a sorted US state list of doubling numbers for positive confirmed cases of COVID19 averaged over the last four days. Just computing, log(2)/(log(X_n)-log(X_n-1)) which is the doubling number. The doubling number is the number of days predicted for the positive confirmed cases to double in number. So, for […]
Maxima
34 posts
State Number of days to double cases england 9.170667077048846 northern_ireland 9.440172590839559 scotland 11.09717971461147 uk 8.984112697842296 wales 5.958681781105541 All warranties explicit or implied as to the accuracy of this data are nil. Explanation of term doubling number. The number of days for the number of cases to double. So for example, […]
state doubling in days Guam 2.4507118742 Rhode_Island 3.9468661952 Texas 4.9776569339 New_Mexico 5.1506057772 South_Dakota 5.3592656446 Alabama 5.4241476357 Mississippi 5.715764637 Massachusetts 5.7239838454 Pennsylvania 6.102194282 Maryland 6.1541184725 Connecticut 6.3795498182 Iowa 6.6594433606 Virginia 6.6741950606 Arizona 6.780725208 Oklahoma 6.9115105295 Nebraska 6.968235808 Puerto_Rico 7.1299124744 Idaho 7.365068418 Colorado 7.4730554834 Kentucky 7.621385874 South_Carolina 7.6768325486 Illinois 8.0810284491 West_Virginia 8.4688522893 […]
On March 6, I predicted that the worldwide total number of confirmed cases would reach 1 million by March 28. The prediction used a doubling number of four days. Today is April 2 and the total number of confirmed cases reached 1 million. So my prediction was off by five […]
I forked data from Tom White’s github, and graphed it,Tom White Covid19 database I formatted the data, and baselined the timeline to January 1, 2020. UK Covid 19 Data
I forked data from the New York times, and graphed it,NY Times Covid19 database I formatted the data, and baselined the timeline to January 1, 2020. A C D, F, G and H I and K L M N O, P, and R S, T, and U V and W

I forked data from the New York times, and graphed it,NY Times Covid19 database I formatted the data, and baselined the timeline to January 1, 2020. This is what the Florida dataset looks like when input to Maxima: (%i37) Florida; (%o37) [[2020-03-01, 2], [2020-03-02, 2], [2020-03-03, 3], [2020-03-04, 3], [2020-03-05, […]
In my post of Doubling Numbers – part 3 I predicted one million cases worldwide on March 28, 2020 — today. Well, I was wrong — there are 660,000 confirmed cases and 30K dead. That prediction was made on March 7, twenty one days ago when there were 21K cases. […]
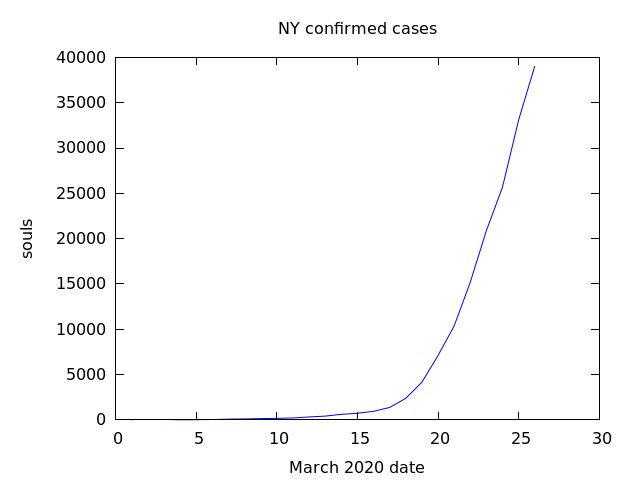
I downloaded the data from the New York Times for confirmed cases covid19 state data from March 1 thru March 26, 2020. Then I plotted this in Maxima. (%i14) plot2d([discrete,NYlog],[title,"NY confirmed cases"], [xlabel,"March 2020 date"],[ylabel,"log souls"], [png_file,"nylog.png"]) (%o14) [/home/nicks/maxout.gnuplot, /home/nicks/nylog.png] (%o14) loveny.mac From eyeballing the graph, one can see that […]
The logistic equation is another model at which the finite population size starts limiting the process. As the number of cases approaches the population size, the rate slows. (%i8) diff(f(x),x)=gamma*f(x)*(G-f(x)); d (%o8) -- (f(x)) = (G - f(x)) f(x) gamma dx Here G is the total population size. As the […]
After a month of indecision, action has come. By restricting peoples’ movement and association, transmission of the virus can be delayed, or stopped. Makes sense in theory — the rapid growth of cases will peak and then subside. That’s the idea. But what does that mean practically? From a numerical […]
In my post on February 10 I predicted that there would be a million cases of coronavirus by March 1. Today, March 6, I am looking at the number of cases outside China reported as 2400 on February 24 and 1200 on February 20. One can use these values to […]