Covid19 Plotting US State Data

I forked data from the New York times, and graphed it,NY Times Covid19 database
I formatted the data, and baselined the timeline to January 1, 2020. This is what the Florida dataset looks like when input to Maxima:

(%i37) Florida;                                                                                                                                          
(%o37) [[2020-03-01, 2], [2020-03-02, 2], [2020-03-03, 3], [2020-03-04, 3],                                                                              
[2020-03-05, 4], [2020-03-06, 7], [2020-03-07, 12], [2020-03-08, 13],                                                                                    
[2020-03-09, 14], [2020-03-10, 23], [2020-03-11, 26], [2020-03-12, 46],                                                                                  
[2020-03-13, 70], [2020-03-14, 70], [2020-03-15, 109], [2020-03-16, 141],                                                                                
[2020-03-17, 210], [2020-03-18, 326], [2020-03-19, 434], [2020-03-20, 564],                                                                              
[2020-03-21, 764], [2020-03-22, 1000], [2020-03-23, 1222], [2020-03-24, 1467],                                                                           
[2020-03-25, 1965], [2020-03-26, 2477], [2020-03-27, 3198]] 

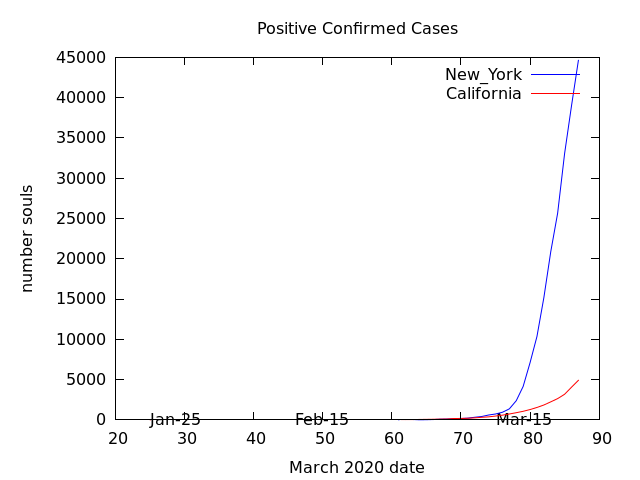
Here is the plot of New York and California:

(%i31) plot2d([[discrete,New_York],[discrete,California]],                                                                                               
              [legend,"New_York","California"],                                                                                                          
              [title,"Positive Confirmed Cases"],[xlabel,"March 2020 date"],                                                                             
              [ylabel,"number souls"],[png_file,"ny_cal.png"],                                                                                           
              [label,["Jan-25",day2020("2020-01-25"),10],                                                                                                
               ["Feb-15",day2020("2020-02-15"),10],                                                                                                      
               ["Mar-15",day2020("2020-03-15"),10]])                                                                                                     
(%o31)       [/home/nicks/maxout.gnuplot, /home/nicks/ny_cal.png]               

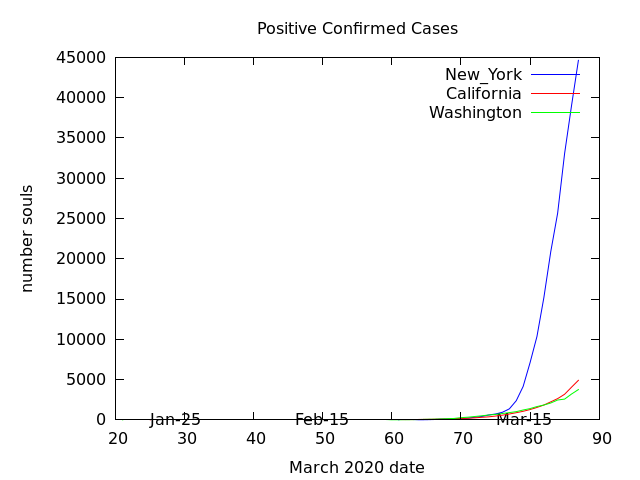
Here is New York, California, and the State of Washington:

Here is New York, California, Washington, Wash DC, Florida, Louisiana, Illinois:

Leave a comment

Your email address will not be published. Required fields are marked *